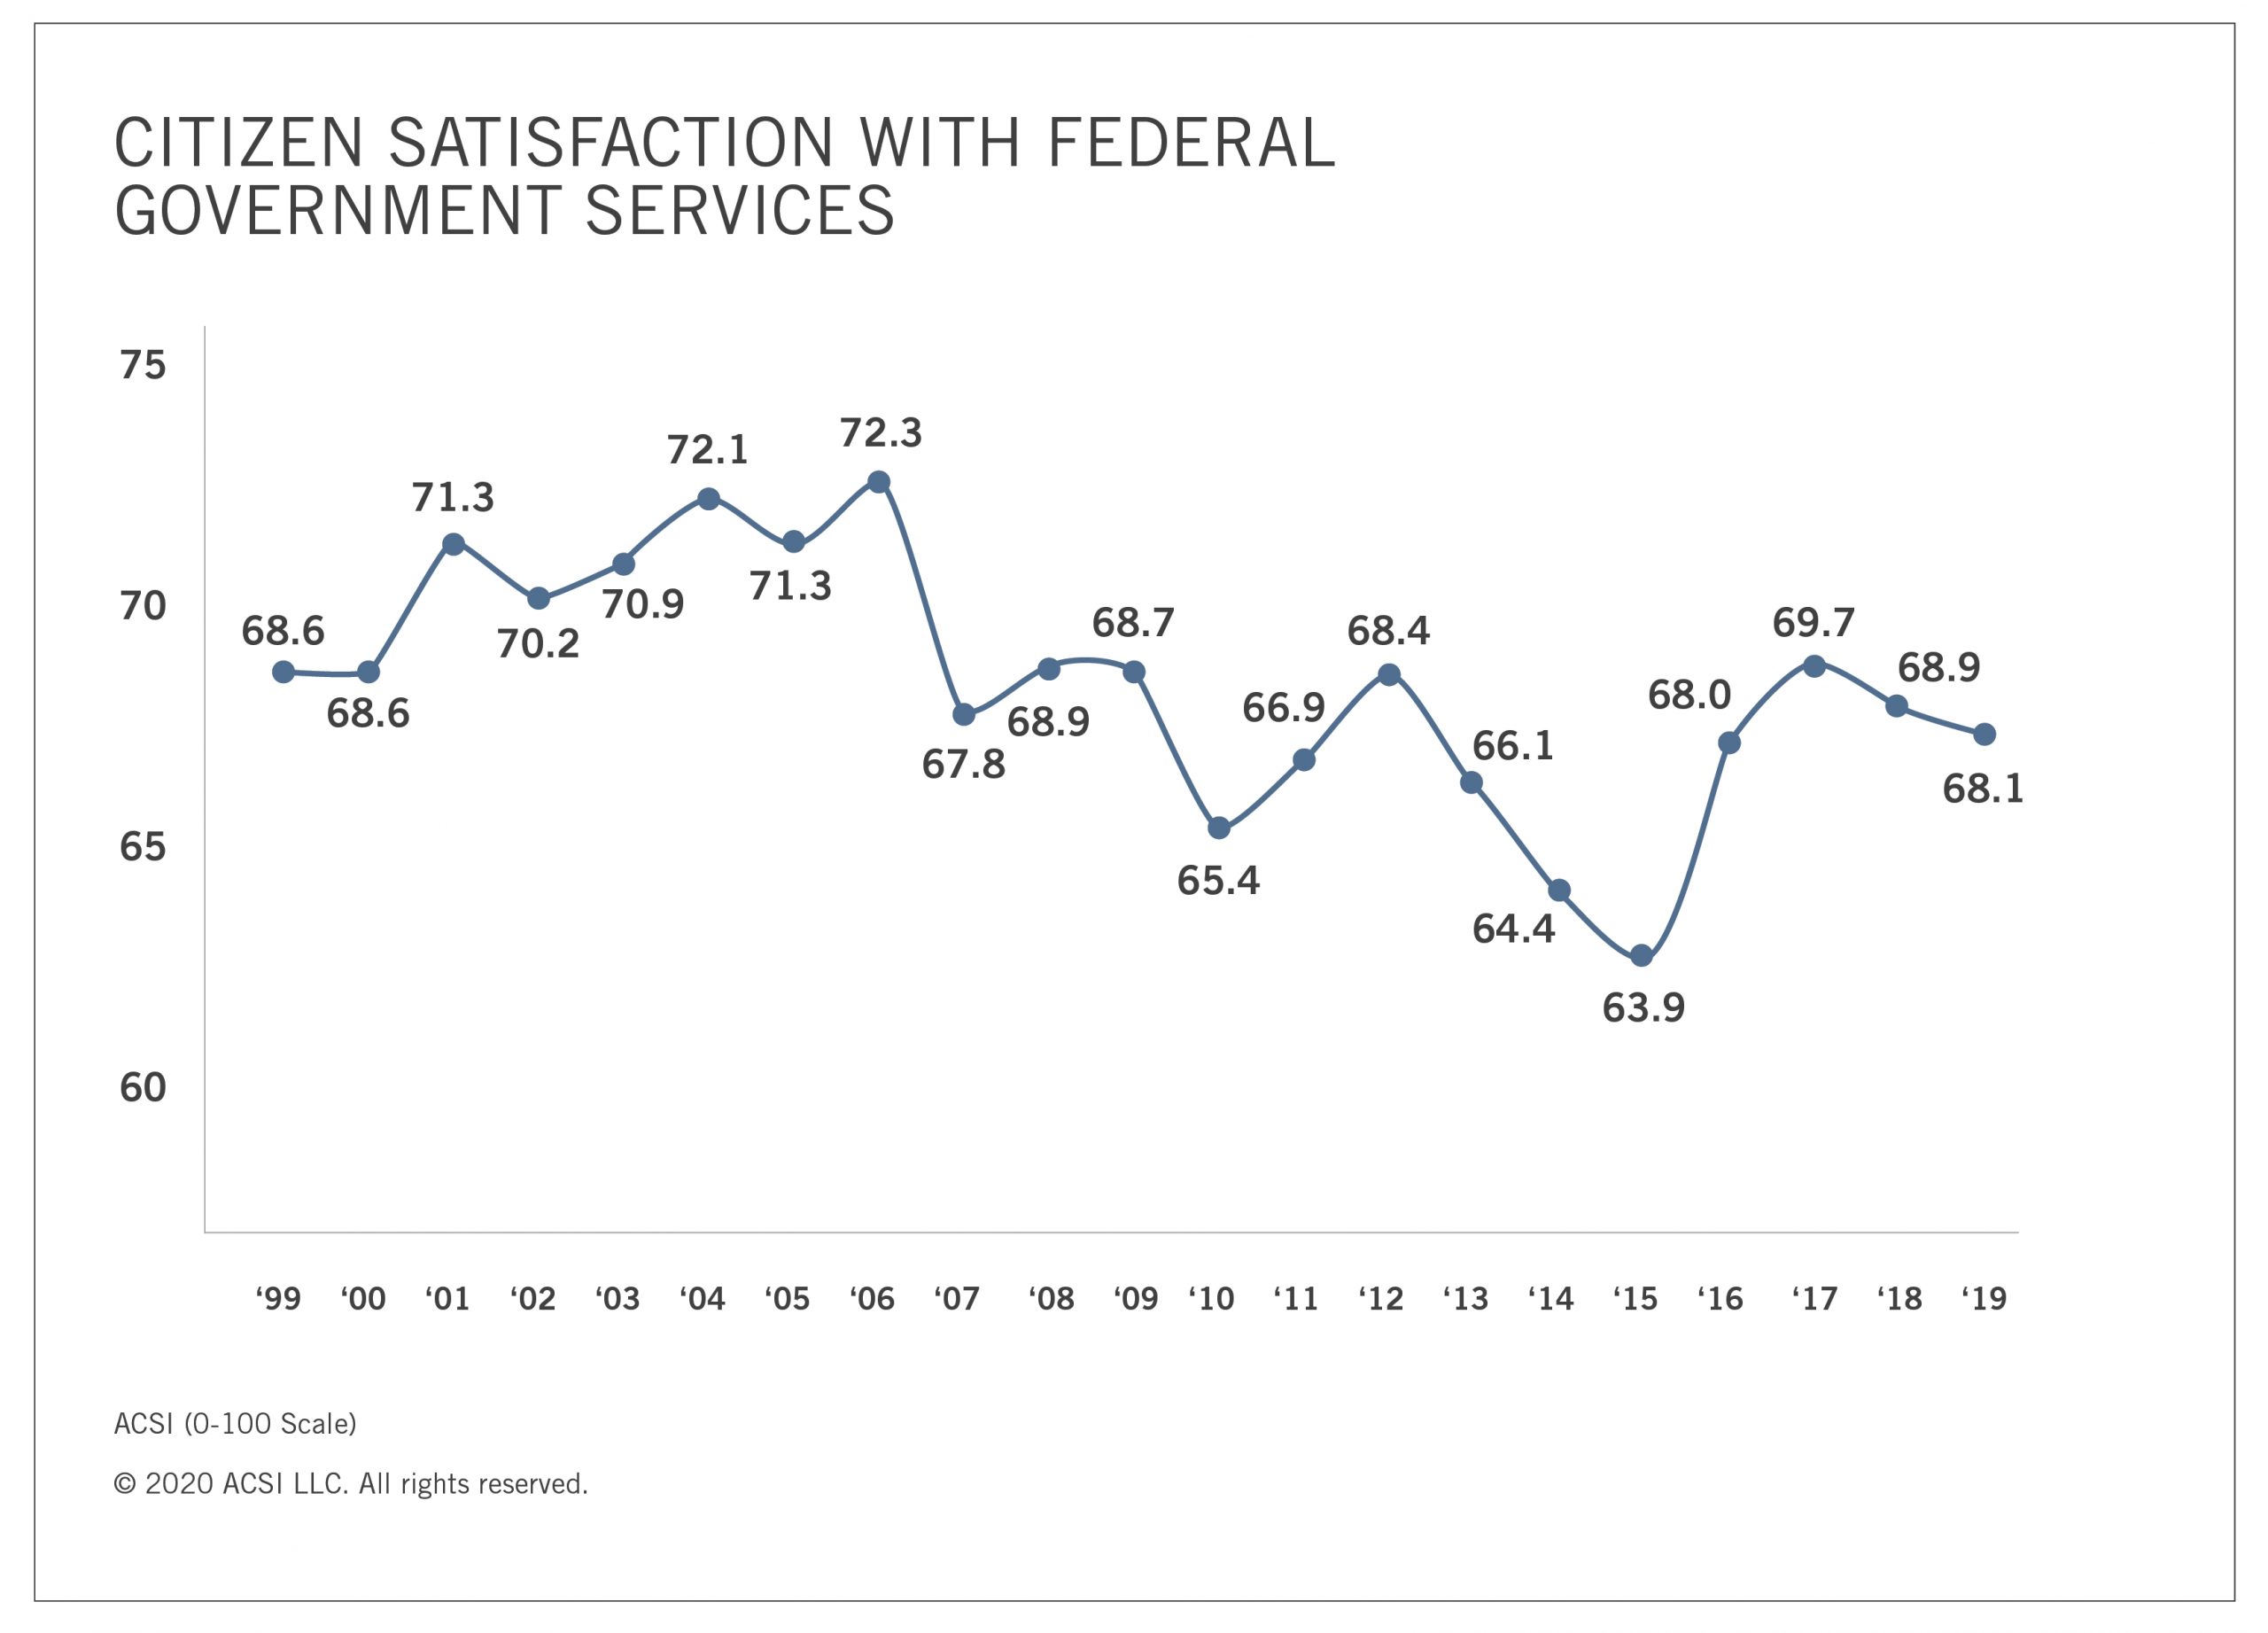
Citizen satisfaction with the U.S. federal government declines for the second straight year, slipping 1.2% to a score of 68.1 (on a scale of 0 to 100) according to the American Customer Satisfaction Index’s Federal Government Report 2019. This virtually erases the considerable gains made between 2015 and 2017.
“The government shutdown in 2019 only fueled the flames of Americans’ diminishing satisfaction in the federal government,” says Forrest Morgeson, Director of Research and Global CSI Manager at the American Customer Satisfaction Index. “With satisfaction figures sliding in back-to-back years, the government’s struggle to satisfy its citizens is growing harder to ignore.”
The report’s results, based on interviews of citizens that have used a federal government service, were collected throughout 2019 – a year marked by significant political strife at the federal level, some of which directly impacted the federal services citizens received.

American citizens’ satisfaction with federal government services over time.
Three out of four drivers of citizen satisfaction experience hiccup
The Index’s federal government model incorporates four primary drivers of citizen satisfaction: process, information, customer service, and website. All but “information” tumble in the most recent report.
Timeliness and ease of government processes drops 3% to 68, professionalism and courtesy of customer service drops 3% to 74, and perceptions of government website quality dips 1% to 75. Perceptions of the federal government’s quality of information stays the same at 71.
These results indicate that no single aspect of federal government services bears responsibility for declining citizen satisfaction in 2019.
Departments of Interior, Commerce, and Justice thrive; HUD continues downturn
Citizen satisfaction scores vary across departments within the federal government. This is to be expected, as these departments offer very distinct services – some of which citizens want, and others they don’t.
The Department of the Interior has the highest citizen satisfaction score at 78, besting the economy-wide national satisfaction score. The Departments of Commerce and Justice follow suit, each at 75.
Once again, the Department of Housing and Urban Development (HUD) scores the lowest among federal departments, sliding to 56. The Department of the Treasury is a bit higher at 60. These two departments are heavily responsible for driving federal government-wide satisfaction down to levels well below the private sector.
Pension Benefit Guaranty Corporation scores high among federal agencies
Citizen satisfaction also varies significantly across federal agencies within departments.
The Pension Benefit Guaranty Corporation (PBGC) is among the highest-scoring agencies, earning a score of 91 from retirees in 2019. The Department of Education’s mobile app myStudentAid posts an impressive rating of 88, while the National Weather Service earns an 86.
On the other hand, agencies within the Treasury Department rank among the lowest. The Internal Revenue Service (IRS) programs, for example, score mostly in the low-to-mid 60s, with both individual paper filers and large business and international filers giving the IRS a rating of 60. In contrast, individual e-filers are much happier (74).
Citizen satisfaction among Republicans improves; Democrats, Independents, and ‘Other Party’ affiliates trend in opposite direction
While the American Customer Satisfaction Index doesn’t measure citizen satisfaction with specific politicians or political parties, political affiliations unavoidably impact citizen satisfaction with government services.
In 2019, only respondents identifying themselves as Republicans report stronger citizen satisfaction with federal services compared to 2017–the first full year of the Trump administration–up 1% to 70. Conversely, Democrats (down 3% to 71), Independents (down 3% to 65), and those affiliated with an “Other Party” (down 11% to 58) all see their satisfaction decline over this same period.
The American Customer Satisfaction Index Federal Government Report 2019 is based on interviews with 2,862 users, chosen at random and contacted via email throughout the year. Download the full report.
Follow the American Customer Satisfaction Index on LinkedIn and Twitter at @theACSI.
No advertising or other promotional use can be made of the data and information in this release without the express prior written consent of ACSI LLC.
Source: the American Customer Satisfaction Index
The American Customer Satisfaction Index has been a national economic indicator for 25 years. It measures and analyzes customer satisfaction with more than 400 companies in 46 industries and 10 economic sectors, including various services of federal and local government agencies. Reported on a scale of 0 to 100, scores are based on data from interviews with roughly 500,000 customers annually. For more information, visit www.theacsi.org.
Leave a Reply